
NewVersion 1.0
Measurement, Uncertainty & Significant Figures
Read a ruler, a vernier caliper, a micrometer and a stopwatch, repeat the readings, and carry their uncertainty through a formula to see what significant figures mean and when two results agree.
About this simulation
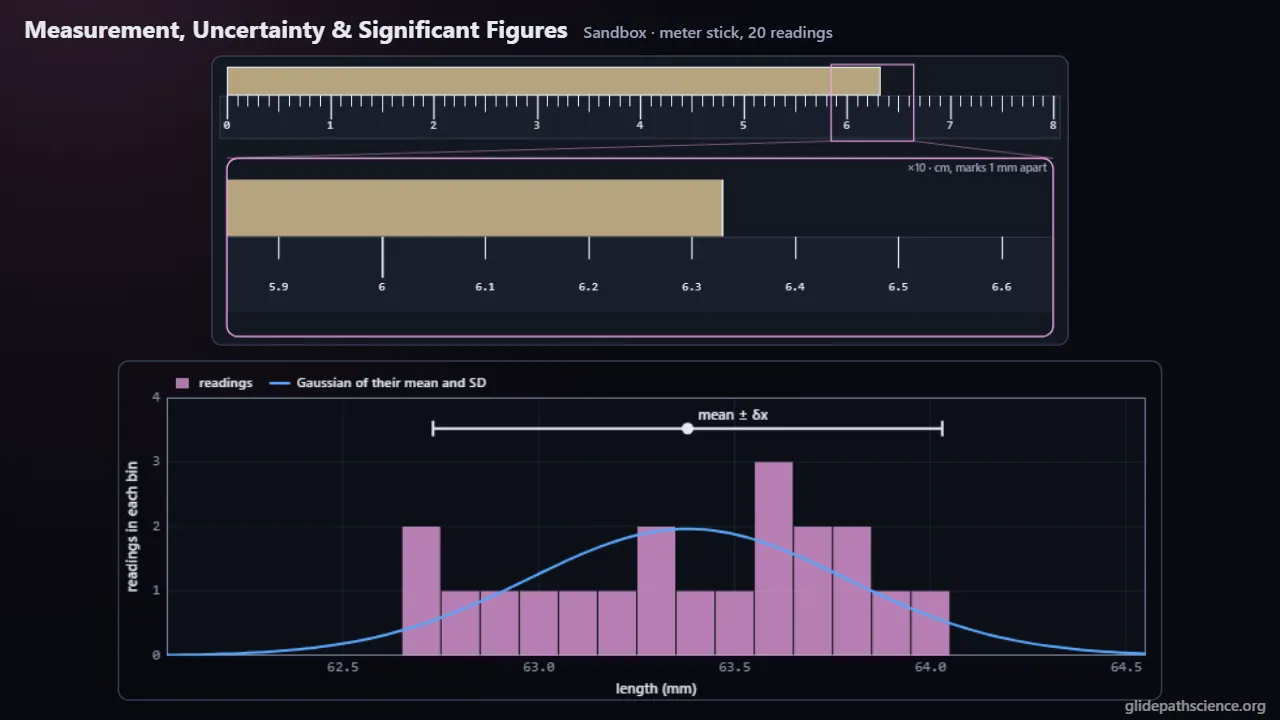
How far can a measurement be trusted? Students read a meter stick, a vernier caliper, a micrometer, a stopwatch and a photogate, take up to 100 readings, hide a zero offset, and watch the mean, the spread, the standard error and the rounded result beside a histogram and its Gaussian. A guided walkthrough at two levels runs from why we measure twice through reaction time, relative uncertainty, the rules for sums, products and powers, significant figures and when they mislead, and agreement; the Advanced track adds Type A and Type B uncertainties, the standard error, the Gaussian, quadrature, correlation, Monte Carlo, weighted means and χ². A Measuring Bench has students read zoomed scales by hand, and the scale itself grades the reading and its uncertainty. A Propagation Lab puts every input of five formulas on a slider, with bars showing which input owns the result’s uncertainty and, in Advanced, a 20,000-draw Monte Carlo beside the formula. A concept challenge with Precise or accurate?, and a prediction lab with Agreement Court and fresh numbers on every run, round it out.
What you'll learn
- Treat every reading as a range set by the scale, the timer, the technique and the object, and report the best value with its uncertainty, x = x̄ ± δx.
- Summarize repeated readings by their mean and spread, and in Advanced use the standard error s/√N to say how far the mean may be off.
- Carry uncertainties through a calculation: absolute uncertainties add for sums and differences, relative ones for products and quotients, a power multiplies its relative uncertainty, and in Advanced independent uncertainties add in quadrature.
- Use significant figures as a shorthand for the uncertainty, recognize when they mislead, and decide that two results agree when their uncertainties cover the gap between them.
What you can do
- Guided walkthroughStep-by-step, in Intro and Advanced tracks.
- SandboxEvery control of the model, to explore freely.
- Virtual labA realistic experiment with measurement noise and data analysis.
- Concept checksQuestions about ideas and vocabulary, with no calculating.
- PredictionCommit to a prediction, then see the result.
- Classroom demoProjector mode and recordable clips for slides.
- Works offlineA single downloadable file, verified to run without a network.
Before you start
- Arithmetic with decimals, percents, powers and square roots
- Rearranging a simple formula
- For the Advanced track: partial derivatives, square roots of sums of squares, and the idea of a probability distribution
Run or download
Run it in your browser
Nothing to install and no account. Works on laptops, Chromebooks, tablets, and phones.
Launch Measurement, Uncertainty & Significant FiguresDownload for offline use
One HTML file (721 kB) that opens in any modern browser with no network: for rooms with unreliable Wi-Fi, or to keep a copy.
Download the fileFile details and checksum
- File
measurement-uncertainty-v1.0.html- Version
- 1.0, released November 15, 2026
- Build
0fd95c8- Size
- 738,737 bytes
- SHA-256
64c49bb2ef08cd0c5283f75508b600beb9a7add9ac16615e44f78e2da127d7c0- Offline
- Checked to run with all network access blocked.
The model and its limits
What the model assumes
- Each reading is the true value plus a Gaussian scatter for technique and any zero offset, rounded to the step the instrument shows.
- A stopwatch timing adds the difference of two reaction delays, so the mean delay cancels and the scatter is the per-press spread times √2; the default spread of 0.05 s per press is illustrative.
- Instruments have typical resolutions, not one maker’s: a meter stick read to 0.1 mm, a vernier caliper to 0.1 mm, a micrometer to 0.01 mm, a stopwatch to 0.01 s and a photogate to 0.1 ms.
- The reading uncertainty is half the resolution at Intro, and in Advanced its Type B standard uncertainty is the resolution over √12; an uncertainty is rounded to one significant figure (two when it starts with 1) and the value to the same decimal place.
- The Intro track uses the simple upper-bound rules and the Advanced track standard uncertainties added in quadrature; the Monte Carlo draws 20,000 seeded samples from Gaussian inputs and takes its 95 % interval from the sorted results.
What it leaves out
- Technique errors are Gaussian and independent from reading to reading; real ones can be skewed or correlated, a hand’s delays are not exactly Gaussian, and a real stopwatch truncates rather than rounds its display.
- Scales do not expand with temperature and instruments do not drift between calibrations.
- Student t coverage factors for small samples, Bayesian methods, and uncertainties in both x and y of a fit are beyond this sim.
- The agreement thresholds and the rounding rule are conventions chosen for teaching; a laboratory or a journal may set its own.
Cite this simulation
APA 7
Meier, D. (2026). Measurement, Uncertainty & Significant Figures (Version 1.0) [Computer simulation]. Glidepath Science. https://glidepathscience.org/simulations/measurement-uncertainty/
MLA 9
Meier, David. Measurement, Uncertainty & Significant Figures. Version 1.0, Glidepath Science, 2026, glidepathscience.org/simulations/measurement-uncertainty/.
AIP
D. Meier, Measurement, Uncertainty & Significant Figures, version 1.0 (Glidepath Science, 2026), https://glidepathscience.org/simulations/measurement-uncertainty/.
BibTeX
@misc{meier2026measurementuncertaintysignificantfigures,
  author       = {Meier, David},
  title        = {{Measurement, Uncertainty & Significant Figures}},
  year         = {2026},
  publisher    = {Glidepath Science},
  version      = {1.0},
  note         = {Interactive simulation, version 1.0},
  howpublished = {\url{https://glidepathscience.org/simulations/measurement-uncertainty/}},
  url          = {https://glidepathscience.org/simulations/measurement-uncertainty/}
}
Credits and license
Created by Dr. David Meier, Glidepath Science.
Licensed under Creative Commons Attribution-NonCommercial-ShareAlike 4.0 International (CC BY-NC-SA 4.0). You may share and adapt it for noncommercial purposes, such as teaching, with credit and under the same license. Licensing and reuse
AI tools (Claude, from Anthropic, and ChatGPT, from OpenAI) were used in developing Glidepath Science and its simulations. Dr. David Meier reviewed, edited, and modified every release version.